Simplifying Stitch ETL’s Quickbooks Data in Redshift: Introduction
This is the first post of a six-part series of posts explaining how we make analyzing Quickbooks data easier by creating cached data sets from complex queries, resulting in simplified tables that anyone at our company is able to easily understand.
- Part 1: Introduction + Shadow Schema Strategy Explanation
- Part 2: The Quickbooks Shadow Schema
- Part 3: Budgets Table
- Part 4: Cash Movements Table
- Part 5: Expenses Table
- Part 6: Revenue Table
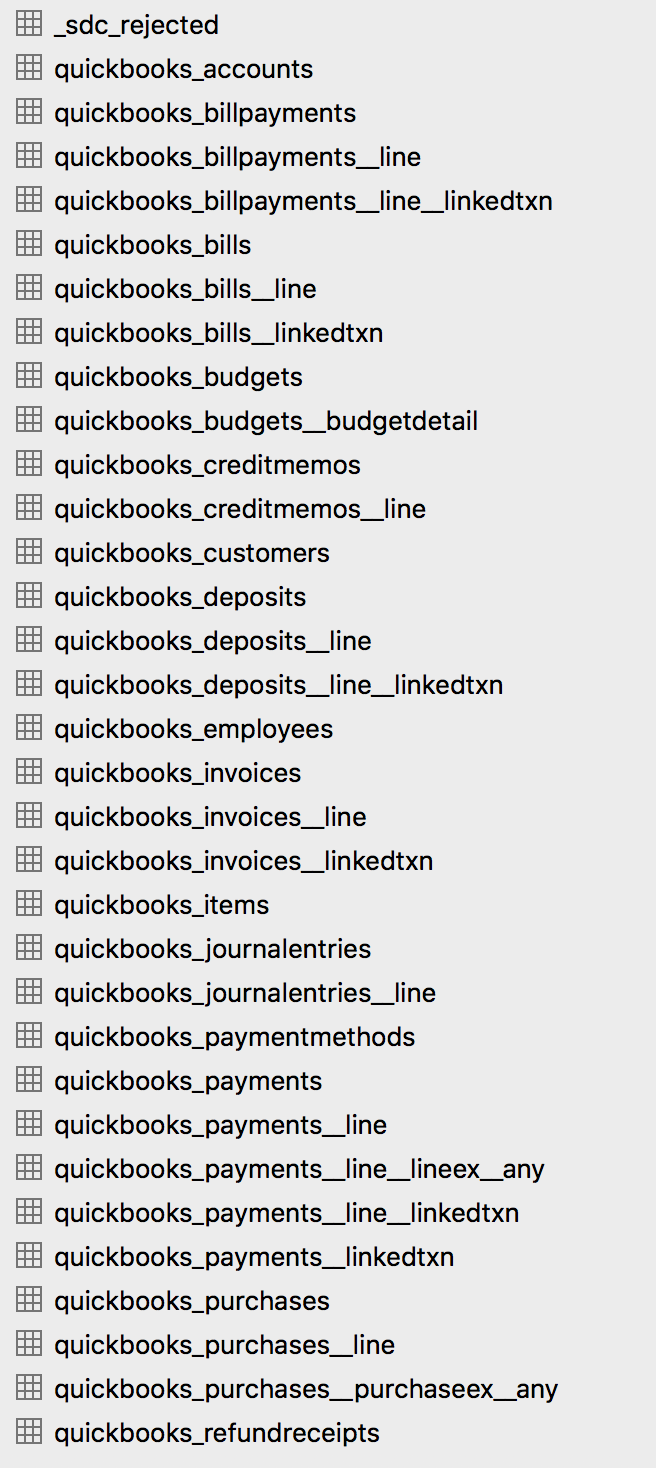
Stitch exports Quickbooks Online data in the way that Quickbooks structures its API – each type of record is its own separate object, and each object has child objects with transaction details. Journal Entries, Invoices, Payments, Receipts, Vendor Credits, Customers, Credit Memos, Bills, Accounts, Deposits, Employees, Items, and Refunds are all broken down into multiple tables each when replicated into your data warehouse using the Stitch connector. Unfortunately, that leaves it up to an analyst to reconstruct the datasets needed to analyze things like revenue, expenses, cash flows, etc.
I’ve spent the countless hours necessary to reconstruct the data into cached data stores that we use to actually analyze and visualize our Quickbooks data. This post demonstrates each of those queries.

Some of the 40 tables created by the Stitch Quickbooks ETL process
The “Shadow” Schema Method
In addition, I’ve created a “shadow” schema of quickbooks data with a separate, custom ETL pipeline. The Quickbooks connector in Stitch will not detect deleted objects, since it uses incremental replication. For example: imagine your accounting team creates an invoice and sends it to a customer. The next time your Stitch ETL process runs, it will create that Invoice in your data warehouse. If the customer then notifies your accounting team of an error, the accounting team might delete the invoice within Quickbooks and create a new one. The erroneous Invoice and the correct Invoice will both be replicated in your data warehouse, and there is no way to determine that the erroneous one was subsequently deleted. In analyzing your data, you will double-count that Invoice and create errors.
The solution to this issue for our company was to create a separate ETL process that queries the Quickbooks API and retrieves all the different parent objects. It TRUNCATE’s each table in the “shadow” schema, and inserts a fresh copy of all the valid objects with their ID’s.
Since the “shadow” schema has all the valid ID’s for the parent objects and the Stitch-created schema has all the details of your Quickbooks data, by performing a LEFT JOIN you can query for only the objects that still exist. This method is complicated and isn’t a perfect solution, but it works for our company. I’ll post the code that extracts the shadow schema in a separate post.
The Cached Data Sets
We use Chartio for most analysis, dashboards, and visualization. One of the major benefits of Chartio is their “Data Stores” feature, which allows me to created curated, cached data sets from custom queries to our data warehouse. This prevents users across our company from having to sift through the massive amounts of complex data, and only see the simplified, more easily understood data sets.
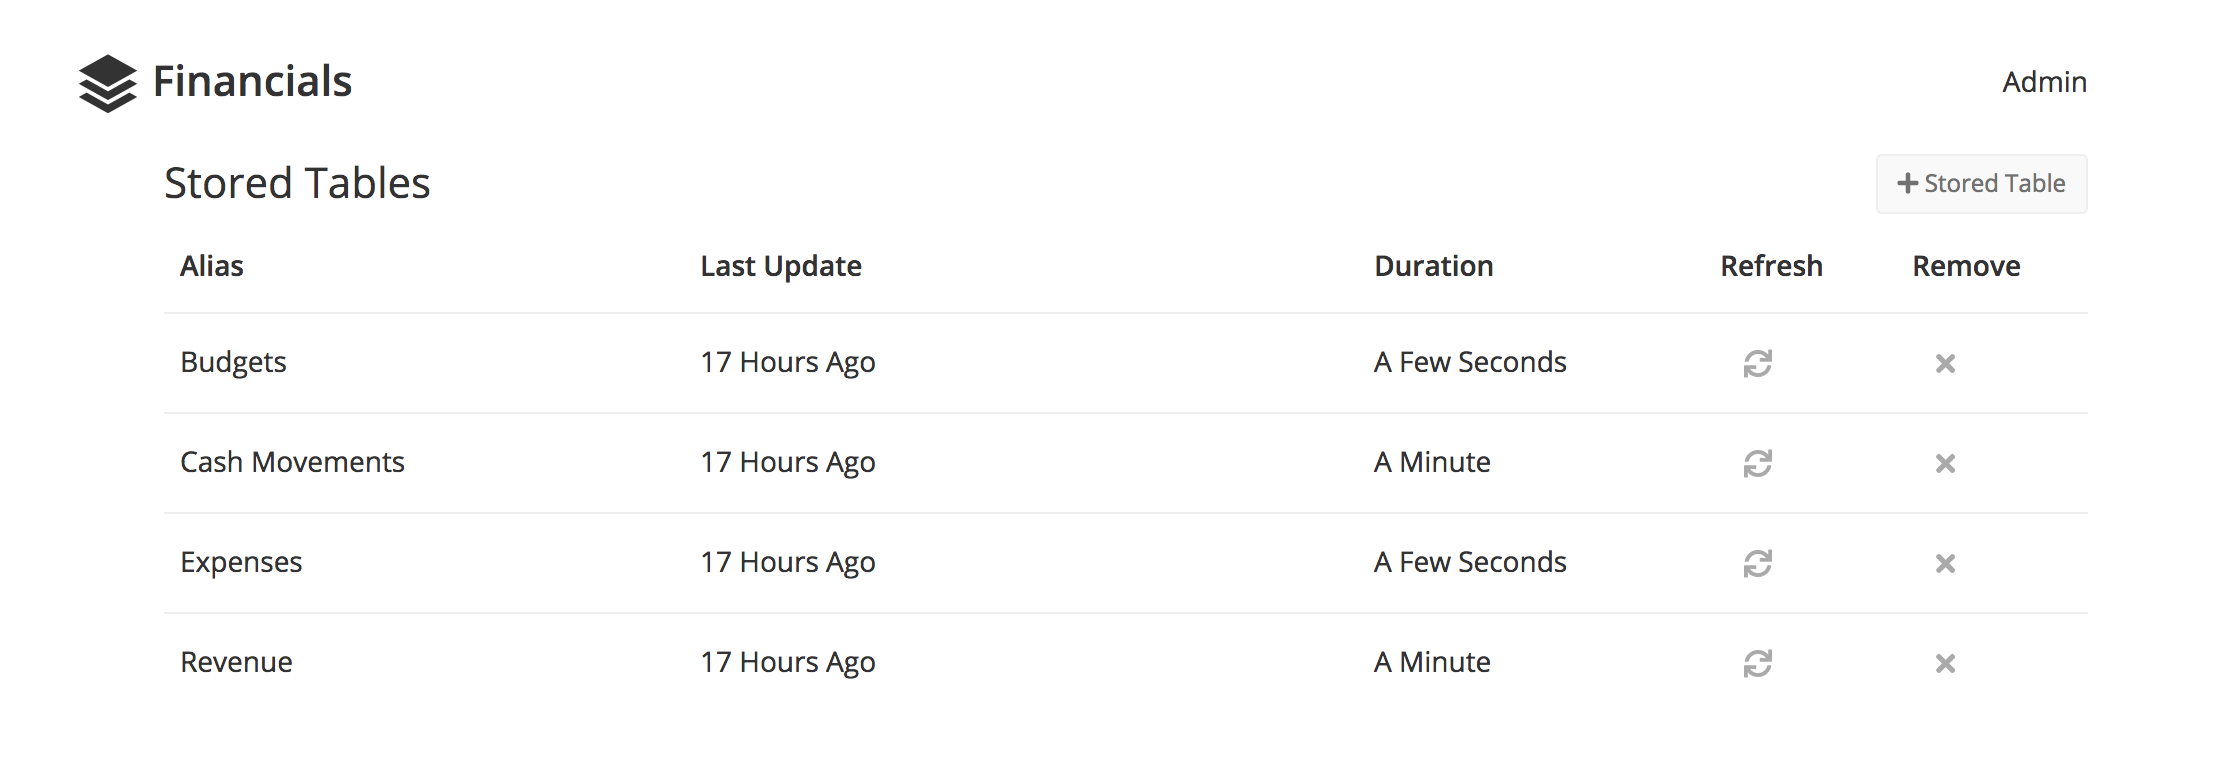
For Quickbooks, I have four tables available in this cached data store: Budgets, Cash Movements, Expenses, and Revenue.

4 tables are available to anyone in our company via the Chartio Data Store feature.
There are certainly other data sets that would be useful for other companies, but these four foundational tables have been sufficient for our team.
Budgets is a simple table that summarizes the budgets set for each account within Quickbooks.
Cash Movements is an aggregated table of the transactions that, when summed up, show the balance in each Account that holds cash (checking, savings, etc.)
Expenses is an aggregated table of all the transactions where we are spending money.
Revenue is an aggregated table of all the transactions where we are earning money.
Up Next:
Simplifying Stitch ETL’s Quickbooks Data in Redshift: The Shadow Schema
